
How We Helped Amazon DSPs
At LastMile Excellence, we understand that achieving and maintaining excellence in operational performance is crucial for your success. Our tailored Performance Optimization Services are designed to help you enhance your key performance indicators (KPIs) and drive continuous improvement across your operations. By leveraging advanced analytics, real-time monitoring, and expert consultation, we provide actionable insights to improve your Overall Score, CDF DPMO, CED, DCR, and Packages Delivered.
Our team of experienced professionals will work closely with you to identify inefficiencies, optimize workflows, and implement best practices that align with your strategic goals. Whether it's reducing distractions and speeding events, improving Customer Delivery Feedback (CDF) and Delivery Completion Rate (DCR), or increasing packages delivered, we offer customized solutions to elevate your performance metrics.
With our data-driven approach, we ensure that every decision is backed by comprehensive analysis and clear visualizations, enabling you to make informed choices that drive tangible results. Our proactive support and continuous monitoring help you stay ahead of potential issues, ensuring smooth operations and sustained growth.
Partner with us to transform your operational metrics and achieve new levels of efficiency and excellence. Let’s work together to optimize your performance, enhance your delivery standards, and exceed your business objectives.
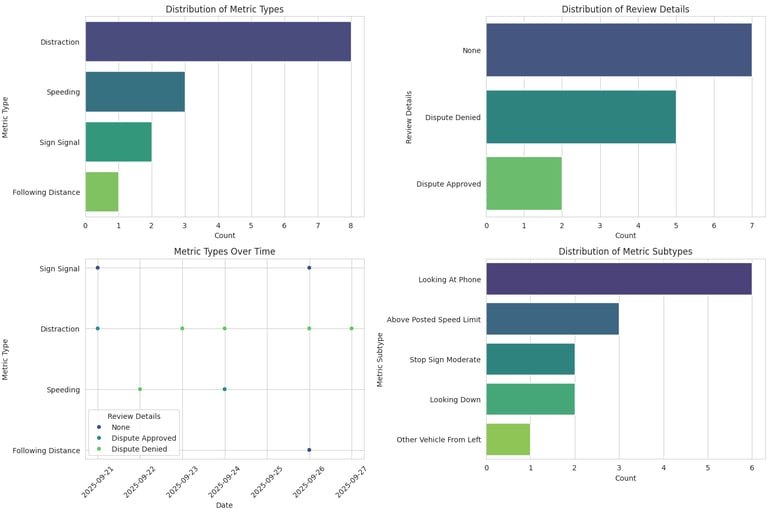
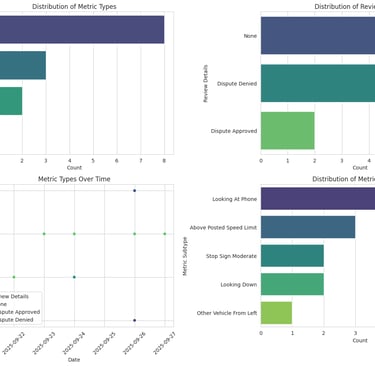
Safety Distribution of Metric Types:
Distribution of Review Details: Displays how often disputes are approved, denied, or not reviewed.
Metric Types Over Time: Scatter plot showing how metric types are distributed across dates.
Distribution of Metric Subtypes: Frequency of specific metric subtypes (e.g., "Looking At Phone," "Above Posted Speed Limit").
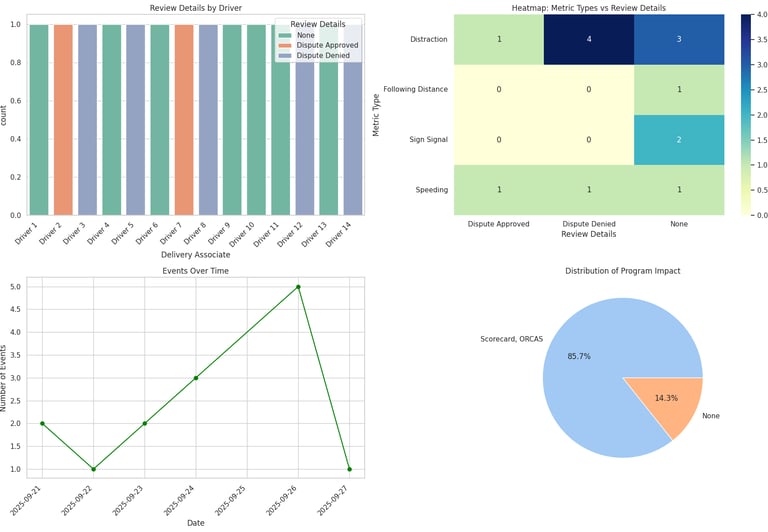
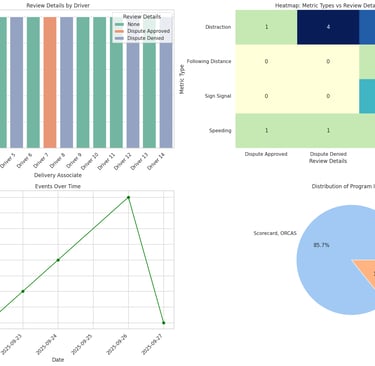
Details By Driver Review:
Heatmap: Metric Types vs. Review Details: A heatmap showing the correlation between metric types and review details.
Events Over Time: A line plot showing the number of events recorded each day.
Distribution of Program Impact: A pie chart showing the proportion of different program impacts.
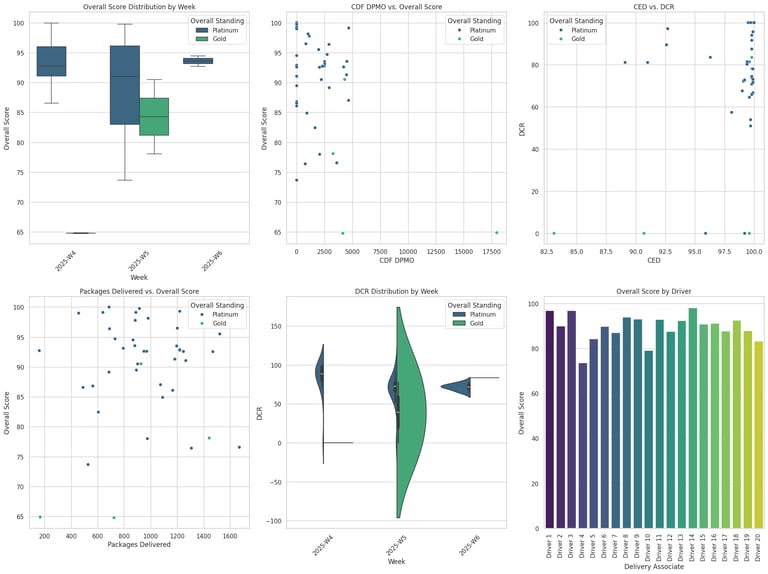
Overall Scorecard:
Overall Score Distribution by Week: Box plot showing the distribution of overall scores for each week, colored by overall standing.
CDF DPMO vs. Overall Score: Scatter plot showing the relationship between CDF DPMO and overall score, colored by overall standing.
CED vs. DCR: Scatter plot showing the relationship between CED and DCR, colored by overall standing.
Packages Delivered vs. Overall Score: Scatter plot showing the relationship between the number of packages delivered and overall score, colored by overall standing.
DCR Distribution by Week: Violin plot showing the distribution of DCR scores for each week, colored by overall standing.
Overall Score by Driver: Bar plot showing the overall score for each driver.
Below is examples of data insights we use to help your decisions.
Cost Analysis
We help with invoice reconciliation by providing a streamlined process that includes centralized documentation, automated matching of invoices to purchase orders, and real-time reporting capabilities to ensure accuracy and efficiency.
This Invoice Analytics Dashboard transforms raw invoice data into actionable business intelligence that drives smarter financial decisions. By visualizing payment trends, cost distributions, and monthly invoice volumes at a glance, finance teams can quickly identify spending patterns, monitor cash flow cycles, and spot anomalies that require attention. The dashboard enables managers to track key metrics like pending payments and average invoice values in real-time, helping prioritize collections and optimize payment schedules to improve working capital. The cost breakdown analysis reveals exactly where money is being allocated across fleet operations, payroll, insurance, and other categories, empowering leaders to identify cost-saving opportunities and negotiate better terms with vendors. With historical trend analysis, businesses can forecast future expenses more accurately, plan budgets with greater confidence, and make data-driven decisions that improve profitability. Instead of manually sifting through spreadsheets for hours, stakeholders can now access critical financial insights instantly, reducing reporting time by up to 90% while ensuring everyone from executives to accountants has the visibility they need to keep operations running efficiently and financially healthy.